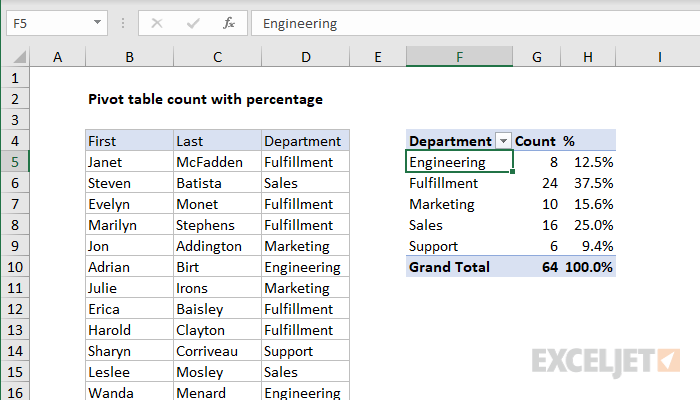
To display data in categories with a count and percentage breakdown, you can use a pivot table. In the example shown, the field "Last" has been added as a value field twice – once to show count, once to show percentage. The pivot table shows the count of employees in each department along with a percentage breakdown.
Fields
The pivot table shown is based on two fields: Department and Last. The Department field is configured as a Row field, and the Last field is a Value field, added twice:
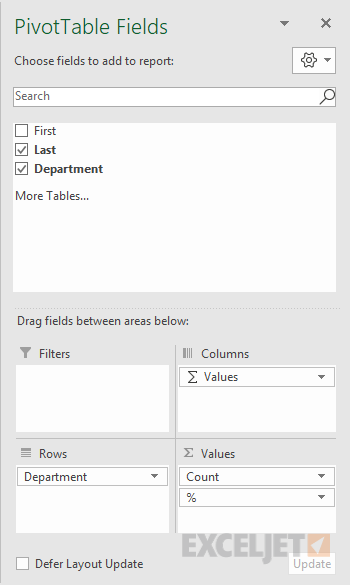
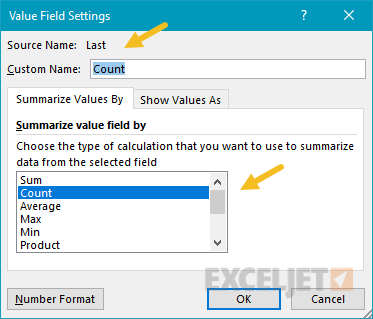
The Last field has been added twice as a value field. The first instance has been renamed "Count", and set summarize by count:
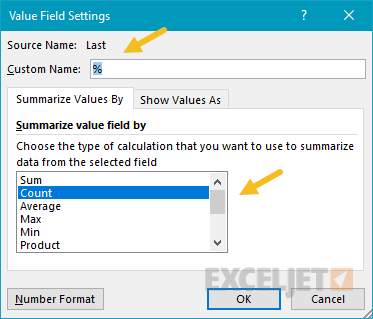
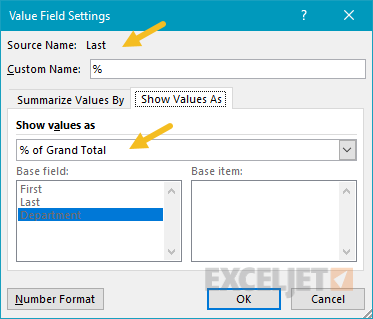
The second instance has been renamed to "%". The summarize value setting is also Count, Show Values As is set to percentage of grand total:
Steps
- Create a pivot table
- Add Department as a Row field
- Add Last as a Value field
- Rename to "Count"
- Summarize by Count
- Add Last as a Value field
- Rename to "%"
- Summarize by Count
- Display Percent of Grand Total
- Change number formatting to percentage


