Purpose
Return value
Syntax
=COSH(number)- number - The hyperbolic angle.
Using the COSH function
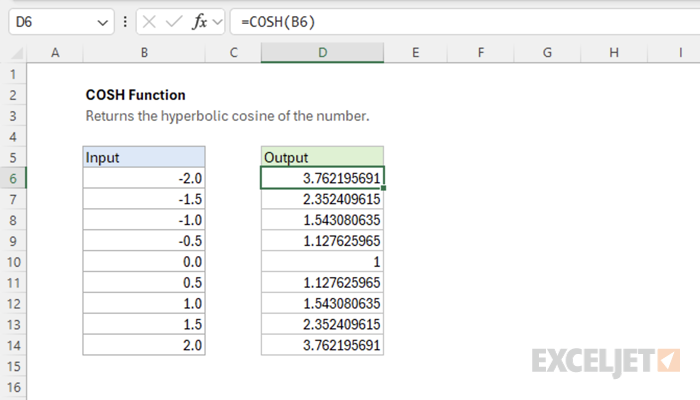
The Excel COSH function returns the hyperbolic cosine of a number, which represents a hyperbolic angle. Given the input of 1, the function returns the value 1.543080635.
=COSH(1) // returns 1.543080635
Explanation
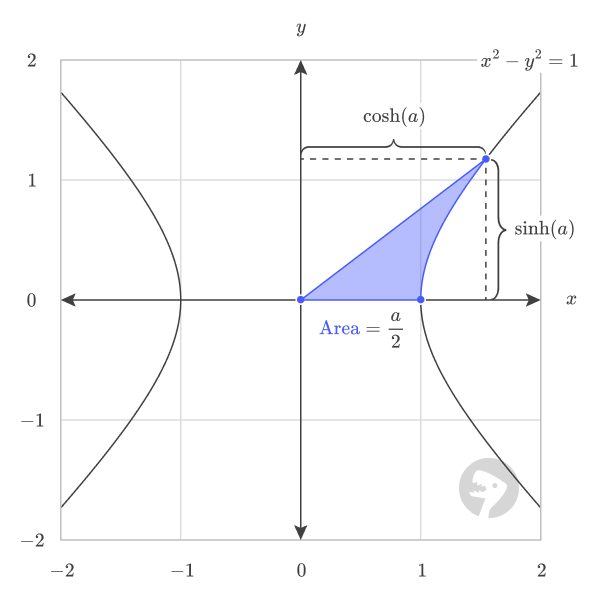
The hyperbolic cosine function returns the horizontal component of the point on the right branch (x ≥ 1) of the unit hyperbola corresponding to the hyperbolic angle given as input.

Together with the hyperbolic sine function, the functions parameterize the right branch of the unit hyperbola given by the equation x² - y² = 1. In plain language, this means that the two functions trace out the shape of the right branch of the unit hyperbola. Given a hyperbolic angle corresponding to a point on the hyperbola's curve, COSH returns the horizontal component of the point, while SINH returns the vertical component of the point.
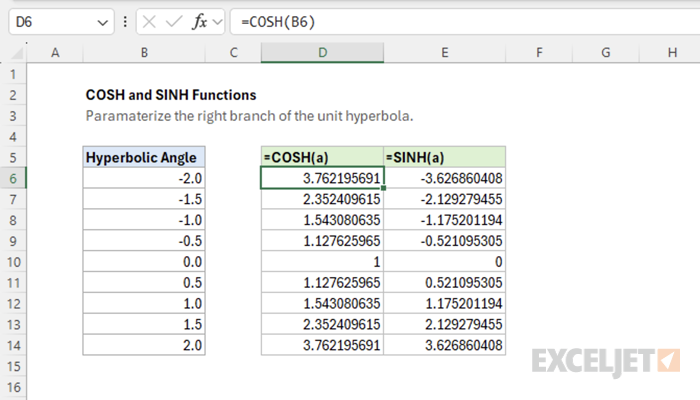
For example, given the hyperbolic angle -1, hyperbolic cosine returns the x-component 1.543080635, and hyperbolic sine returns the y-component -1.175201194.

Here is a table that shows some points on the unit hyperbola formed by COSH and SINH.

As the value of the hyperbolic angle gets larger, the horizontal component diverges to infinity. This is different from the circular cosine function, which is periodic and repeats values.

Images courtesy of wumbo.net.


