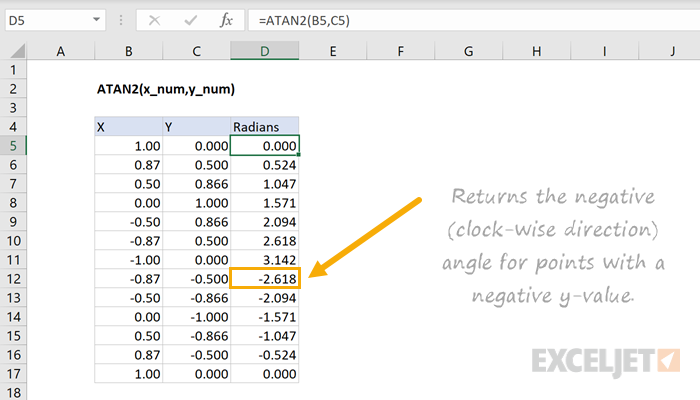
=ATAN2(x_num, y_num)- x_num - The x coordinate of the input point.
- y_num - The y coordinate of the input point.
Using the ATAN2 function
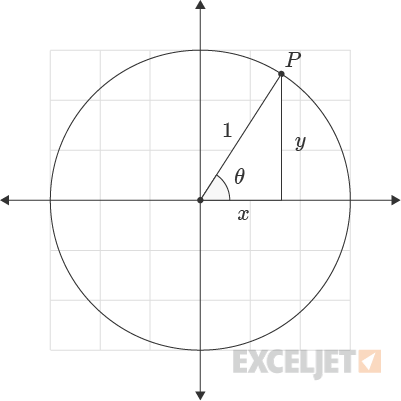
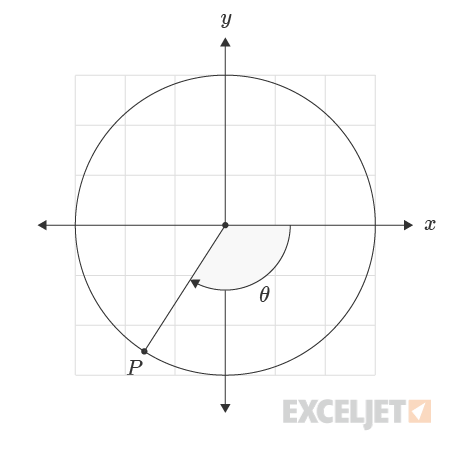
The Excel ATAN2 function returns the arctangent from the x and y coordinates of a point. In geometric terms, the function returns the radian angle corresponding to the coordinates of the input point. If you imagine a ray starting from the origin of the coordinate system and extending outwards, every point along the ray will return the same angle value. A circle of radius one demonstrates all possible return values for the function.
For negative y-values the function returns a negative angle. An angle is measured from the positive x-axis direction with the positive direction in the counter-clockwise direction and the negative direction in the clockwise direction.
Convert Output to Degrees
To convert the output of the ATAN2 function from radians to degrees the formula is:
=ATAN2(x,y)*180/PI() // Returns angle in degrees
Alternatively, the degrees formula can be used to convert the angle to degrees.
=DEGREES(ATAN2(x,y))// Returns angle in degrees
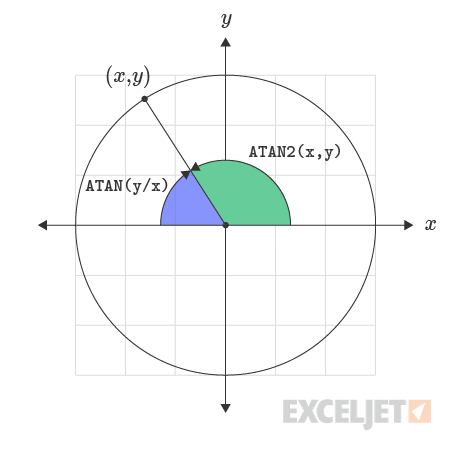
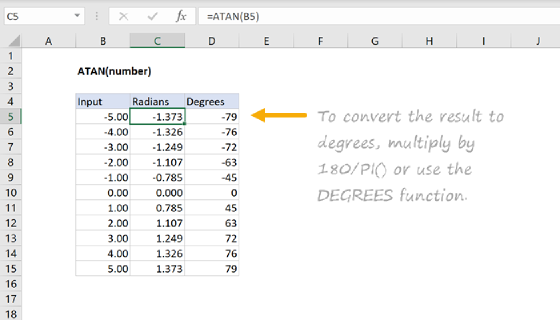
Difference Between ATAN and ATAN2
For points in the first and fourth quadrant, the ATAN2 function returns identical output to the ATAN function. This relationship is expressed in the formula below:
= ATAN2(x,y) = ATAN(y/x)
For points in the second and third quadrant, the ATAN function returns the angle relative to the negative x-direction axis.