=NORM.S.DIST(z, cumulative)- z - Numeric z-score value.
- cumulative - Logical value that determines the form of the function.
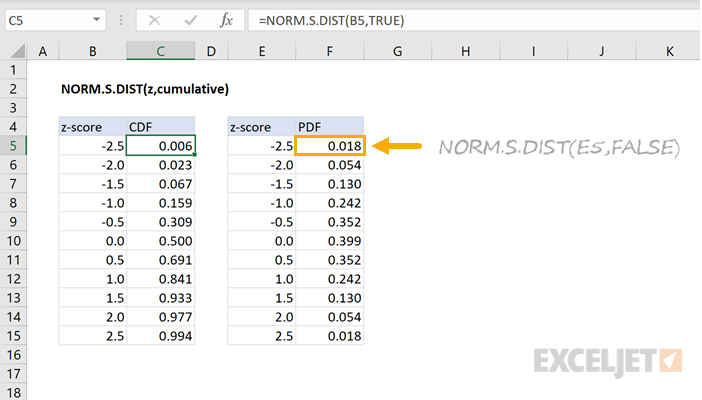
Using the NORM.S.DIST function
The NORM.S.DIST function returns values for the standard normal cumulative distribution function (CDF) and the standard normal probability density function (PDF). For example, NORM.S.DIST(1,TRUE) returns the value 0.8413 and NORM.S.DIST(1,FALSE) returns the value 0.2420. The parameter, z, represents the output we are interested in and cumulative flag indicates whether the CDF or PDF function is used.
=NORM.S.DIST(1,TRUE)=0.8413 // Returns the standard normal CDF
=NORM.S.DIST(1,FALSE)=0.2420 // Returns the standard normal PDF
NORM.S.DIST expects Standardized Input
NORM.S.DIST expects standardized input in the form of a z-score value. A z-score value represents how far a value is from the mean of a distribution in terms of the standard deviation of the distribution. To calculate the z-score, subtract the mean from the value and then divide by the standard deviation or use the STANDARDIZE function as shown in the two formulas below:
=(x-mean)/standard_deviation // calculates z-score
=STANDARDIZE(x, mean, standard_deviation) // calculates z-score
Note, see the NORM.DIST function for non-standardized input.
Cumulative Flag
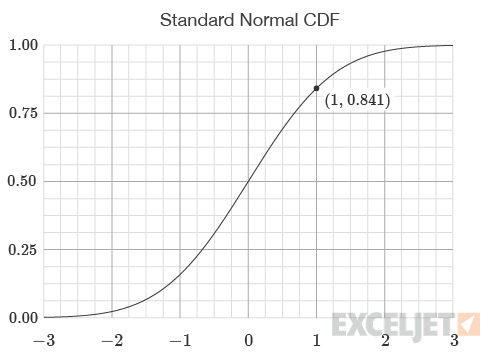
The cumulative flag determines which distribution function is used. If the flag is set to FALSE, the standard normal PDF is used. If the flag is set to TRUE, the standard normal CDF is used. The output of the CDF corresponds to the area under the PDF to the left of a threshold value. For example, when the flag is set to TRUE the standard normal CDF is returned as shown in the graph below. The output of the CDF represents the likelihood of an event occurring below an input value.
=NORM.S.DIST(1,TRUE)=0.8413
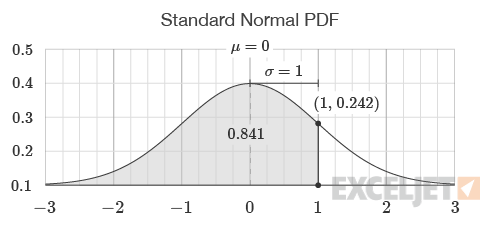
When the cumulative flag is set to FALSE, the standard normal PDF is used. The output of the CDF corresponds to the area under the PDF to the left of a threshold value. For example, with an input of 1 and the cumulative flag set to FALSE the return value is 0.242. For the same input, with the cumulative flag set to TRUE, the function returns 0.841 which is the area to the left of 1 on the normal bell-shaped curve. This is shown below:
=NORM.S.DIST(1,FALSE)=0.242
Explanation
The standard normal PDF is a bell-shaped probability density function described by two values: The mean represents the center or "balancing point" of the distribution. The standard deviation represents how spread out around the distribution is around the mean. The standard normal distribution is a special case of a normal distribution where the mean is 0 and the standard deviation is 1.
Probabilities
Probability density functions model problems concerning continuous ranges. For example, the probability of a student scoring exactly 93.41% on a test is very unlikely. Instead, it makes sense to compute the probability of the student scoring between 90% and 95% on the test. In this example, using a PDF that describes the distribution of test scores, the probability of an event occurring between two thresholds is equal to the area under the PDF's curve for the two values.
Note: Historically, due to the complexity of computing values on and areas below the normal PDF, a standardized version was created to make looking up pre-computed values in a table easier.
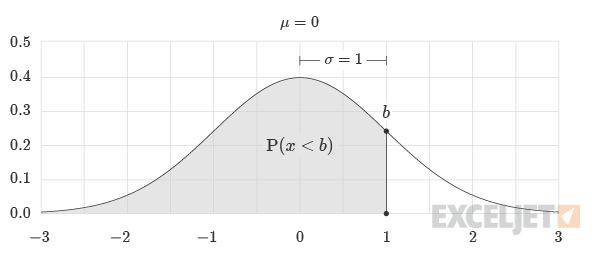
Calculating Probability Below a Threshold
To calculate the probability of an event occurring below the z-score value b the formula would be:
=NORM.S.DIST(b, TRUE)// Returns probability x less than b
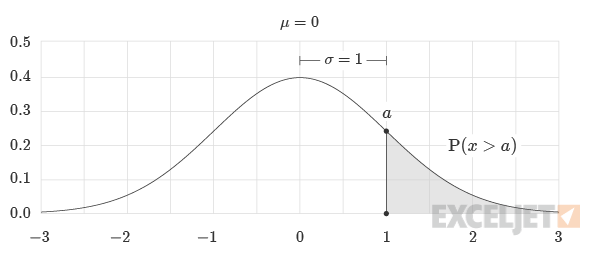
Calculating Probability Above a Threshold
To calculate the probability of an event occurring above the z-score value a the formula would be:
=1-NORM.S.DIST(a, TRUE)// Returns probability x greater than a
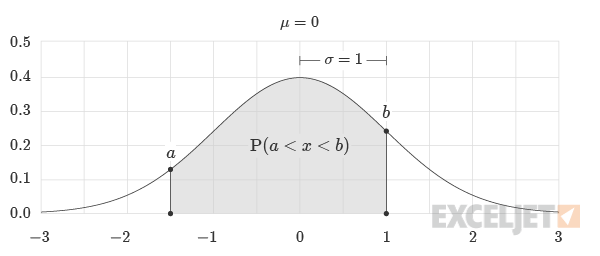
Calculating Probability Between Thresholds
To calculate the probability of an event occurring above a and below b, where b is greater than a, the formula is:
=NORM.S.DIST(b, TRUE) - NORM.S.DIST(a, TRUE)
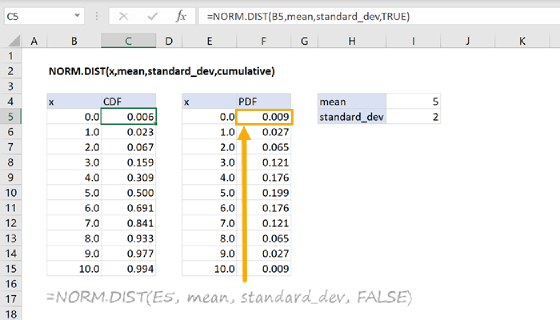
NORM.S.DIST versus NORM.DIST
The difference between the functions NORM.DIST and NORM.S.DIST is NORM.S.DIST uses the standard normal distribution which is a special case of the normal distribution where the mean is 0 and the standard deviation is 1.
=NORM.DIST(x,0,1,cumulative)=NORM.S.DIST(x,cumulative)
When the cumulative flag is set to 0 or FALSE, the functions return the respective points along the distributions.
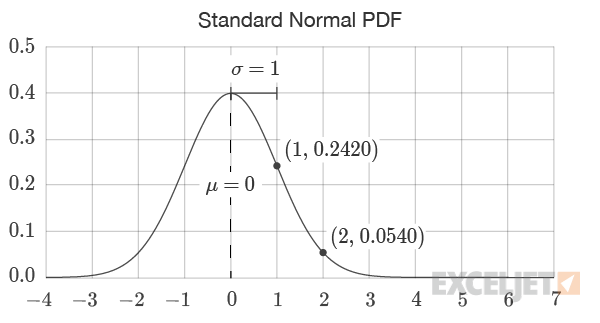
=NORM.S.DIST(1,FALSE)=0.2420
=NORM.S.DIST(2,FALSE)=0.0540

=NORM.DIST(1,3,2,FALSE)=0.1210
=NORM.DIST(2,3,2,FALSE)=0.1760
When the cumulative flag is set to TRUE and the input to NORM.S.DIST is standardized (discussed above), the output of the two functions is the same.
=NORM.S.DIST((x-mean)/standard_deviation, TRUE)
=NORM.DIST(x, mean, standard_deviation, TRUE)
One way to visualize the relationship between the two functions is to highlight the relative areas, divided by standard deviations, underneath the standard normal distribution and a more general normal distribution with a mean of 0 and a standard deviation of 1. This is shown in the graphic below:
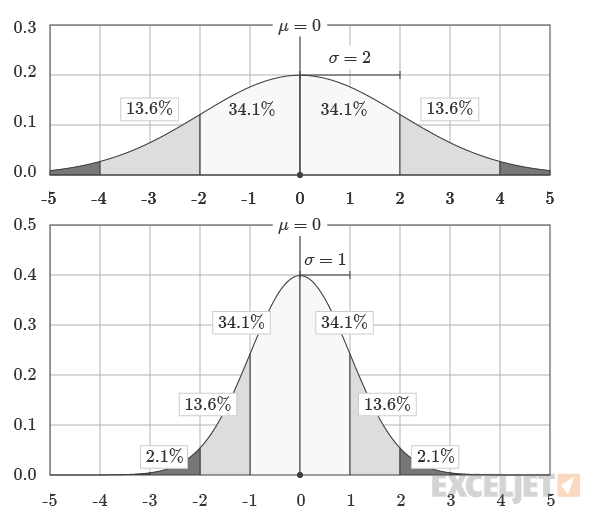
Images courtesy of wumbo.net.