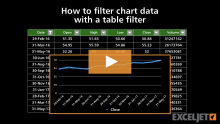
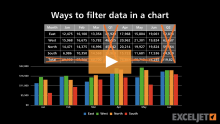
When plotting unsummarized data, the chart filter may not be convenient. In this video, we'll look at how to filter larger sets of data in an Excel Table with filters applied...
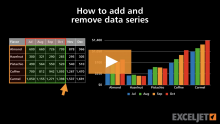
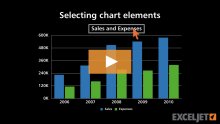
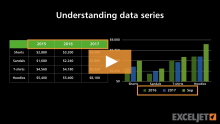
When you create a chart in Excel, you're plotting numeric data organized into one or more "data series". In this video, we'll take a closer look at data series...